DeepSeek V4 Pro vs Fable 5: 23x to 57x Cheaper
DeepSeek shipped V4 Pro with no announcement and a scorecard against Claude Fable 5. A row-by-row read of that table and the 46x price claim.
Late on August 12, DeepSeek put the production version of V4 Pro online. There was no blog post and no announcement page. The only thing that circulated was a scorecard that placed the model in the same table as Claude Fable 5, Anthropic’s most expensive model.
In August I followed the coverage and wrote a headline that said “5% behind, 46x cheaper”. Both numbers are catchy and both fall apart under one follow-up question. An average of which rows? Computed how?
The model card is now public on Hugging Face, so I can work from the original table. My conclusion: both numbers can be reproduced, and each is only one of several ways to do the arithmetic.
How did this table get out?
The route is worth describing first, because it is unusual. Developer Simon Willison wrote down what he saw on August 12:
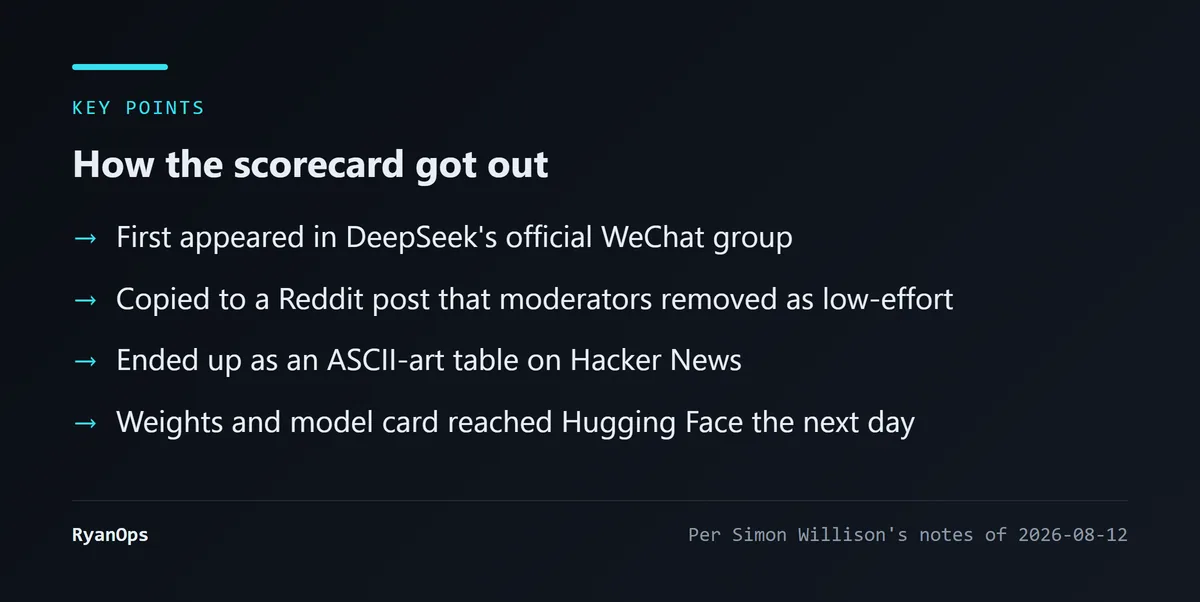 Figure: How the V4 Pro 0813 scorecard travelled (compiled for this article from Simon Willison’s note of 2026-08-12)
The numbers first appeared in DeepSeek’s official WeChat group. Someone posted them to Reddit, where moderators removed the post as “low-effort”. They ended up as a table drawn in ASCII characters on Hacker News.
Willison himself found the new version through OpenRouter. He noted that his link pointed to OpenRouter because DeepSeek had no obvious announcement page.
A company that built a trillion-parameter model had its flagship launch reach Western developers through a WeChat screenshot and an ASCII table. I still find that a little absurd. The weights and the model card went up on Hugging Face the next day, so the numbers below are read from the official card and not from that ASCII table.
What does the table say?
This is the table from the model card:
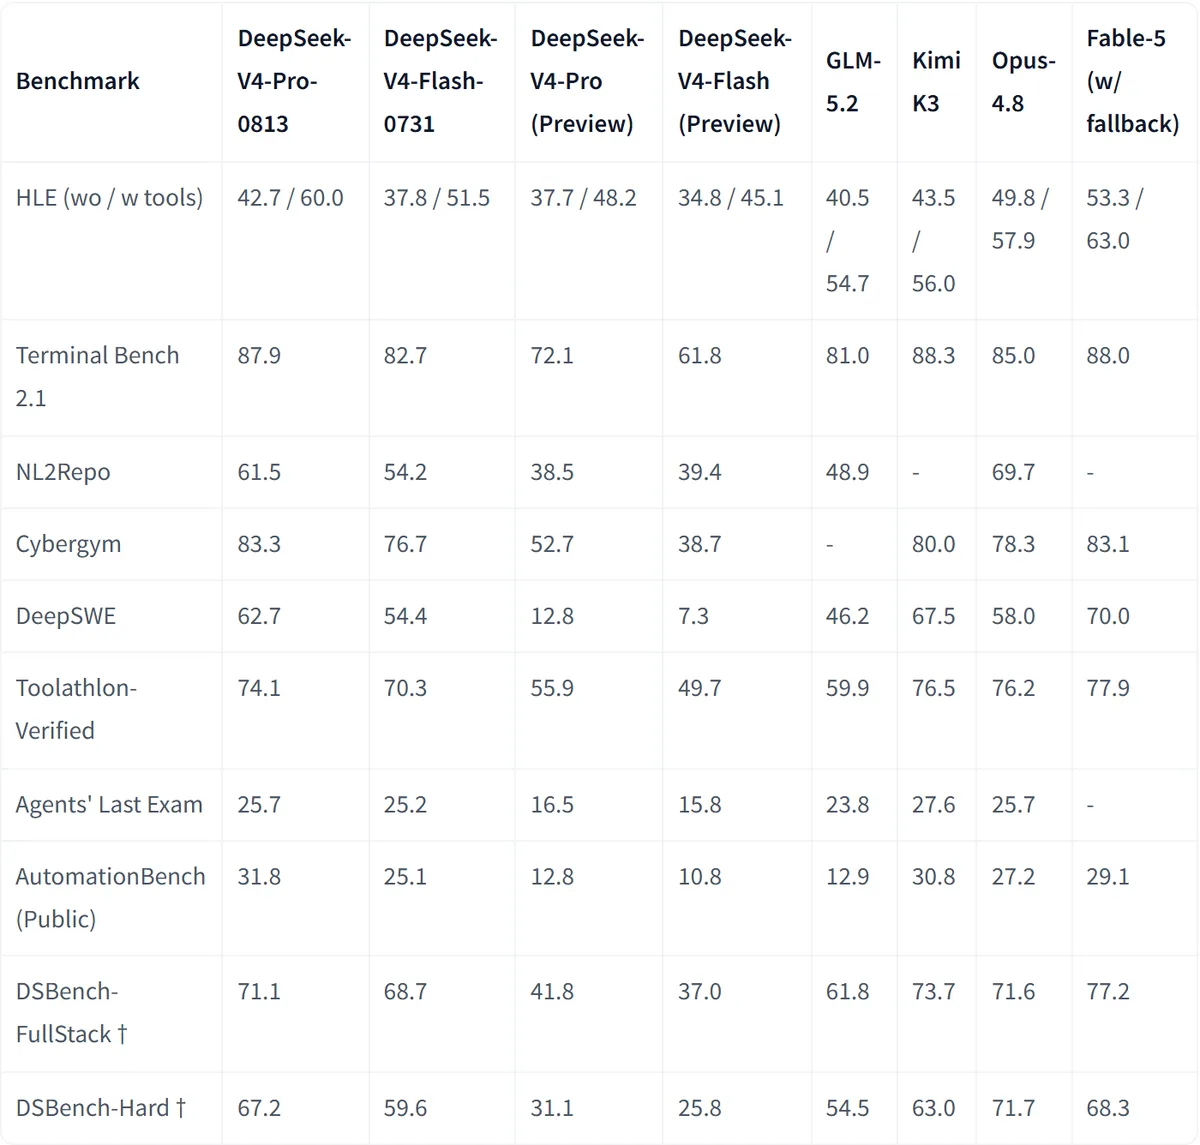 Figure: The evaluation table on the DeepSeek-V4-Pro-0813 model card (source: huggingface.co)
Ten tests, eight models. The rightmost column is Fable-5, followed by “w/ fallback” in brackets. The model card does not explain what that label means and I am not sure either, so I reproduce it as written.
Fable 5 has no score on two of the ten tests (NL2Repo and Agents’ Last Exam), which leaves eight rows that can be compared directly. I worked out the gap for those eight:
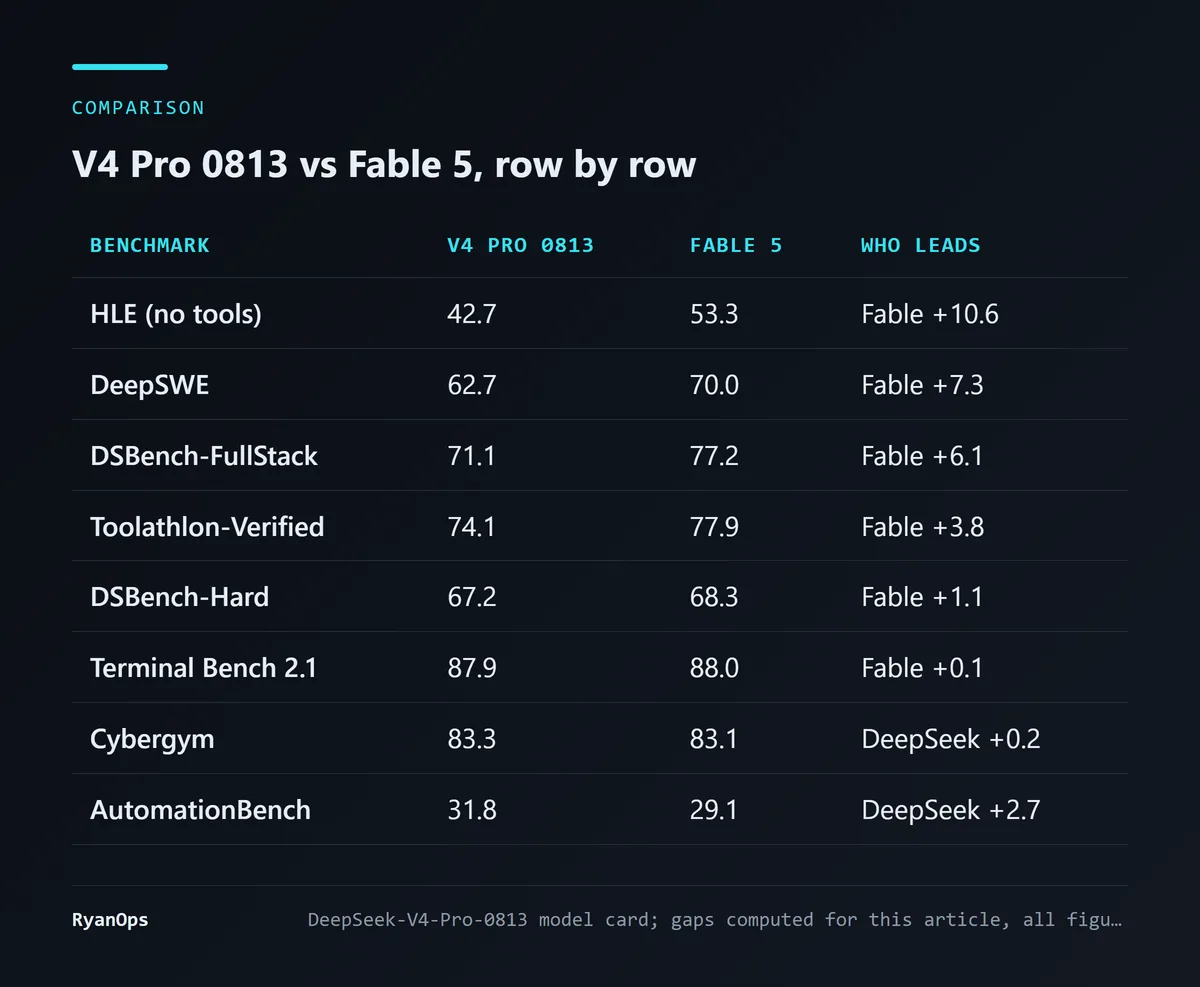 Figure: Row-by-row gap between V4 Pro 0813 and Fable 5 (calculated for this article; raw scores from the DeepSeek-V4-Pro-0813 model card, all published by DeepSeek)
DeepSeek wins two rows: Cybergym (83.3 vs 83.1) and AutomationBench (31.8 vs 29.1). The first is a 0.2-point difference, which is more accurately a tie.
Two more rows are nearly level: Terminal Bench 2.1 is 0.1 behind, DSBench-Hard is 1.1 behind.
Three rows carry the real gap: HLE is 10.6 behind, DeepSWE 7.3, DSBench-FullStack 6.1.
The HLE row holds two numbers. I used the score without tools. With tools it is 60.0 vs 63.0, and the gap shrinks to 3 points.
Where does “5% behind” come from?
There are two ways to compute it, and they give different numbers.
Average the point differences. The eight gaps add up to 26.1 points. Divide by eight and Fable 5 leads by 3.3 points on average.
Average the relative percentages. Express each row as “Fable 5 is this many percent higher than DeepSeek” and average those. The HLE row is 53.3 vs 42.7, which is 25% higher in relative terms and pulls the average up sharply. This method gives about 5%. The 5.3% in the August coverage was probably computed this way.
Neither is wrong. I prefer the first, because these tests have different ceilings and different difficulty. Converting “42 to 53” and “88 to 88” into percentages and then averaging gives the low-scoring tests extra weight.
Another line that was widely quoted at the time: drop HLE and the gap shrinks a lot. That is true. Without HLE, the average point difference across the remaining seven rows is 2.2.
I would be careful with the move of “drop the row with the biggest gap”, though. HLE tests knowledge and reasoning. The other nine are almost all agent tasks, where the model has to do things. So the fairer statement is: on tests of doing things, the two are close; on the test of pure thinking, Fable 5 is clearly ahead. Those are two different conclusions and they should not be averaged into one number.
The August piece also said Fable 5 scored 96% on SWE-bench Verified against 80.6% for V4 Pro. That 80.6% belonged to the April preview. The 0813 model card has no such row, and I have removed the comparison.
What the table does not emphasise
Staring at the Fable 5 column makes it easy to miss the two columns next to it.
Kimi K3 scores higher than V4 Pro on several rows. Terminal Bench 2.1 is 88.3 vs 87.9, DeepSWE is 67.5 vs 62.7, Toolathlon is 76.5 vs 74.1, DSBench-FullStack is 73.7 vs 71.1. DeepSeek listed these numbers in its own table and did not hide them. But the coverage I read, my own August piece included, was headlined “DeepSeek vs Fable 5”, and none of it was headlined “DeepSeek loses to another Chinese model in its own table”.
By the table’s numbers, K3 is higher than V4 Pro on six of the ten rows. V4 Pro wins Cybergym, AutomationBench and DSBench-Hard.
Against Opus 4.8 it is a split. DeepSeek wins Terminal Bench, Cybergym, DeepSWE and AutomationBench, loses HLE (without tools), NL2Repo, Toolathlon and both DSBench rows, and ties Agents’ Last Exam.
Two of the tests were written by DeepSeek. The note under the table says DSBench-FullStack and DSBench-Hard are internal test sets. A vendor comparing itself with others on its own exam paper deserves a discount.
DeepSeek used its own agent framework. The same note says that for the code-agent tasks among the public tests, V4 Pro was run with the minimal mode of DeepSeek Harness at the max reasoning effort. Part of any agent benchmark score comes from the framework, so a different framework may give different numbers.
There is one more thing I cannot tell from the table: who measured the other models. The model card does not say whether DeepSeek ran the competitors itself or quoted the numbers each vendor published.
And where does “46x cheaper” come from?
This number is also real, and it too is only one way of counting.
I read the Fable 5 price from Anthropic’s pricing documentation: $10 per million input tokens and $50 per million output tokens. The V4 Pro price at launch, according to the pricing page as quoted by Unite.AI, was $0.435 input and $0.87 output.
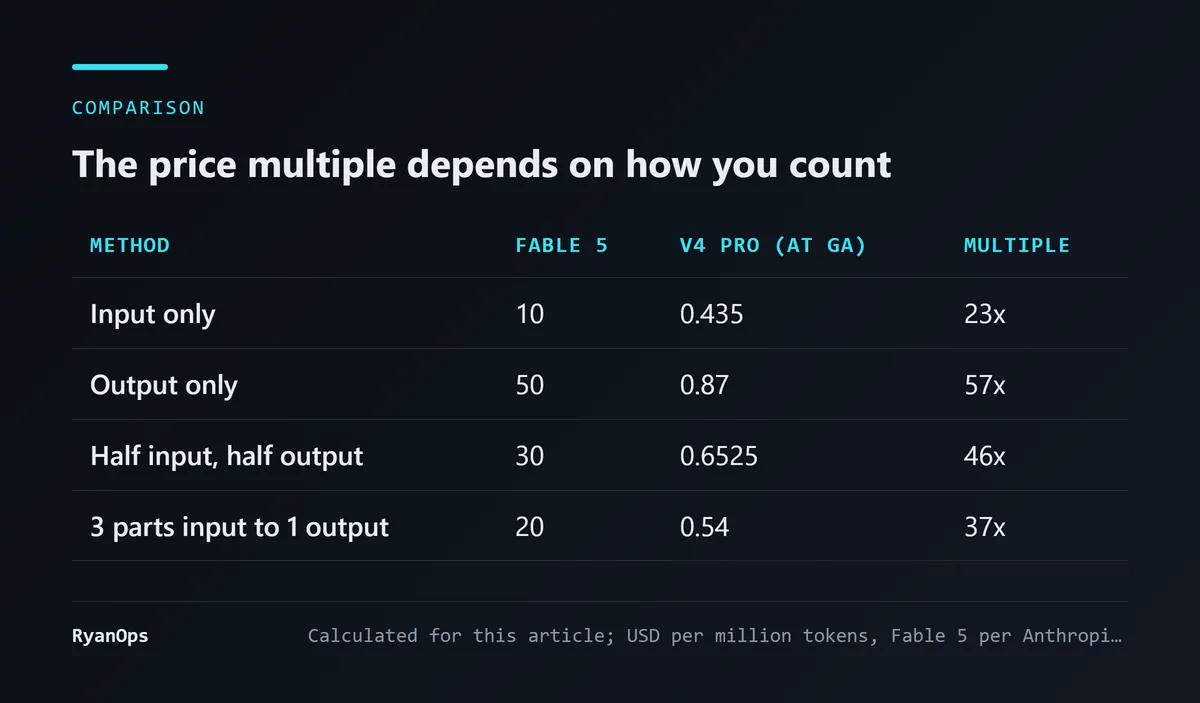 Figure: The Fable 5 to V4 Pro price multiple under different assumptions (calculated for this article; USD per million tokens)
Input alone is 23x. Output alone is 57x. The 46x figure comes from counting input and output half each: $30 against $0.6525.
Few real workloads are half and half. A coding agent usually reads much more than it writes, so input tokens outnumber output tokens several times over. At three to one, the multiple is 37.
The more honest wording is “23x to 57x cheaper, depending on your input-output mix”. That is why I changed the headline.
More important, this price gap lasted four days. DeepSeek announced a price change on August 13, effective August 16. After the change, V4 Pro output costs $1.98 off-peak and $3.96 at peak. Recomputed with the new prices, the output gap is 13x to 25x. That is still large, but it is no longer 57x. I covered this in the other piece from the same day and in the one on the price increase.
I checked the CNY pricing as well. On the pricing page the Wayback Machine saved on August 13, V4 Pro is 0.025 yuan on a cache hit, 3 yuan on a miss and 6 yuan for output, and V4 Flash is 0.02, 1 and 2 yuan. That matches the August coverage.
What else is worth knowing?
Willison’s note contains an observation I find practical. He ran the same prompt on V4 Pro at low, medium and high reasoning effort and got very different results. He said he had not seen a difference of that size on other models.
The level names on the model card are not quite the same as his. The card says reasoning_effort supports three levels, low, high and max, with no medium, and I list each as its source wrote it. What is certain is that the code-agent tests were all run at max.
Here is what that means for you: the scores in the table are the top-effort scores. Top effort produces more thinking tokens, and those are billed at the output price. In practice you either pay more than the list price suggests to get the table’s performance, or you run a lower effort and get lower performance. “46x cheaper” and “only 5% behind” do not necessarily hold under the same setting.
I have no measurements of my own to quantify this. I can only suggest that you treat reasoning effort as a variable when you test.
So how should you read this comparison?
My view is that the table shows one thing and only one thing: on agent tasks, an open-weight model has caught up to within a short distance of the most expensive closed model. A 0.1-point difference on Terminal Bench would have been hard to imagine a year ago.
What it does not show is whether your work will go as well after switching. The reasons are all above: the scores are self-reported, two tests are internal, the runs used top reasoning effort on DeepSeek’s own framework, and the row with the largest gap happens to be the only one that does not test doing things.
What would make me more confident? An independent group running both models under one setup and publishing what each task cost in practice. The multiple on a price list is a per-token gap. What you care about is the gap per finished job.
How this played out afterwards is worth a line too. In September DeepSeek released V4.1 Flash with an even lower output price, and Anthropic’s pricing documentation gained Fable 5.1. Neither model in this table is now its maker’s latest. The term open weight is explained in the glossary.
What this rewrite corrected
- The original “5.3% behind” gave no method. This version shows two methods and their results (3.3 points on average, about 5% in relative terms).
- The original “46x cheaper” assumed an even input-output split. This version lists four mixes and the headline now gives a range.
- The original SWE-bench Verified comparison (96% vs 80.6%) used a preview score and has been removed.
- The original relayed a per-task cost from Artificial Analysis ($3.15 vs $0.03), which compared V4 Flash and not V4 Pro. I could not find the original source this time and removed it.
- The original description of Fable 5’s specifications (launch date, output length) was not re-verified this time. Only the price, confirmed against Anthropic’s pricing documentation, remains.
- The original said it was unconfirmed whether the 0813 weights would be released. They went up on Hugging Face on August 13.


